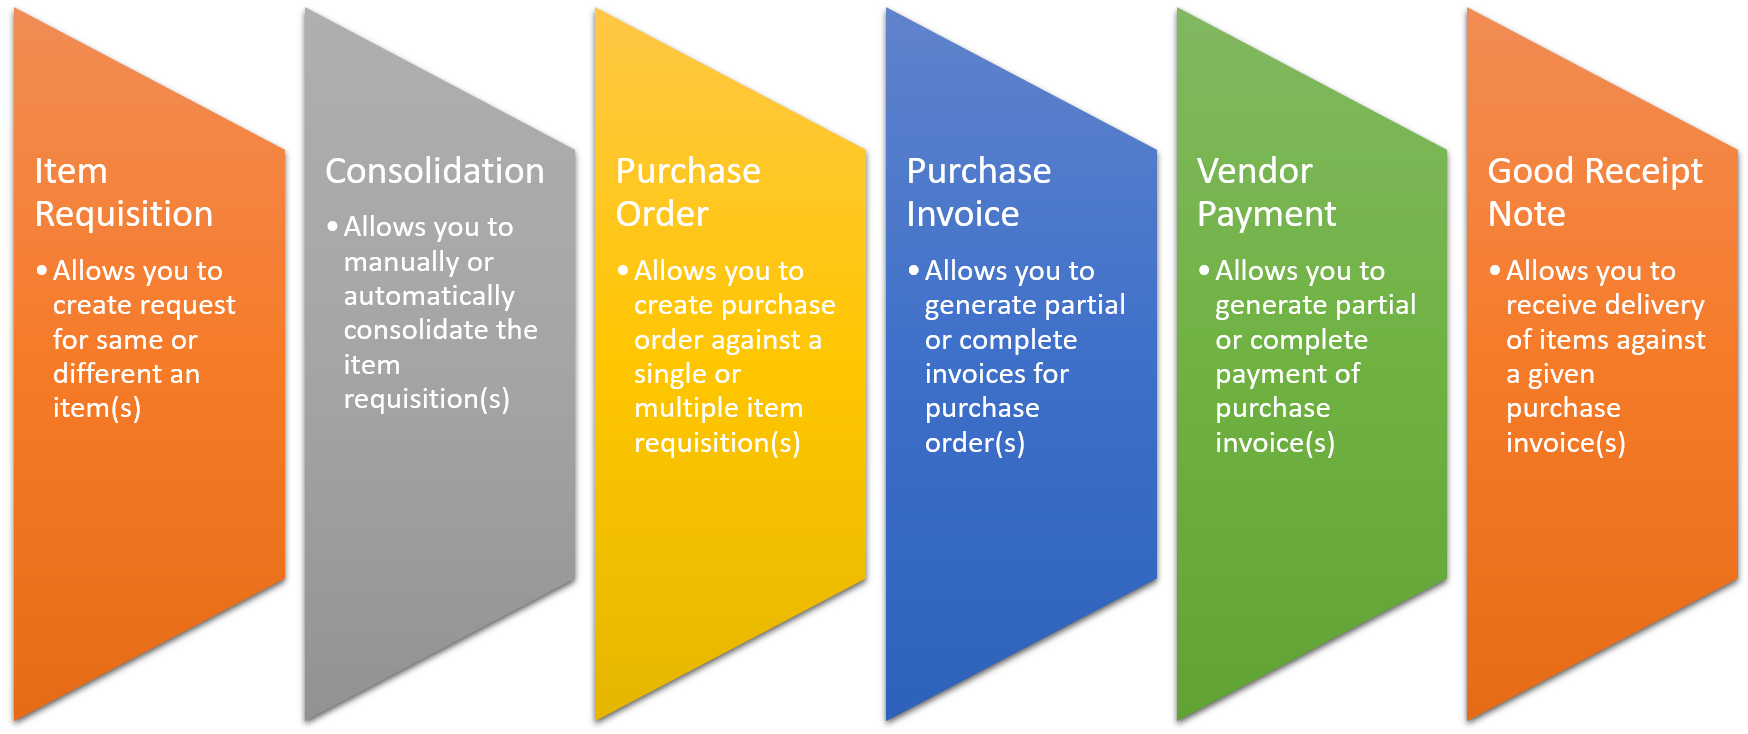
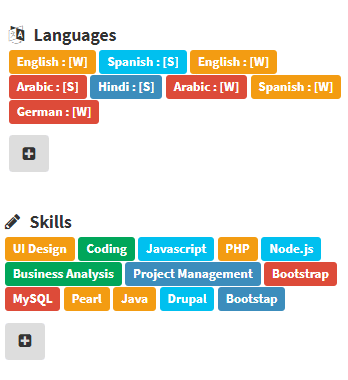
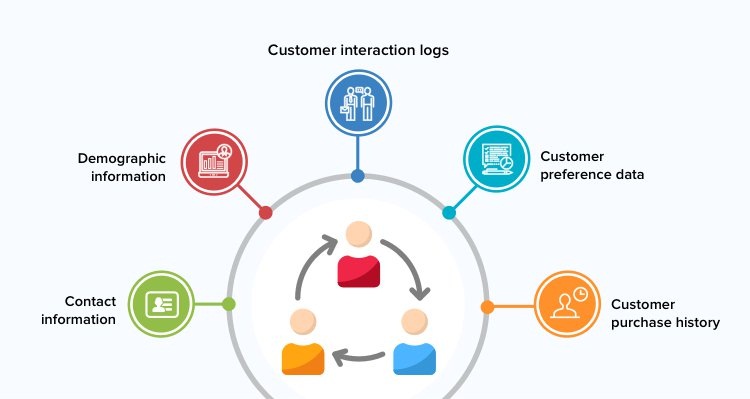
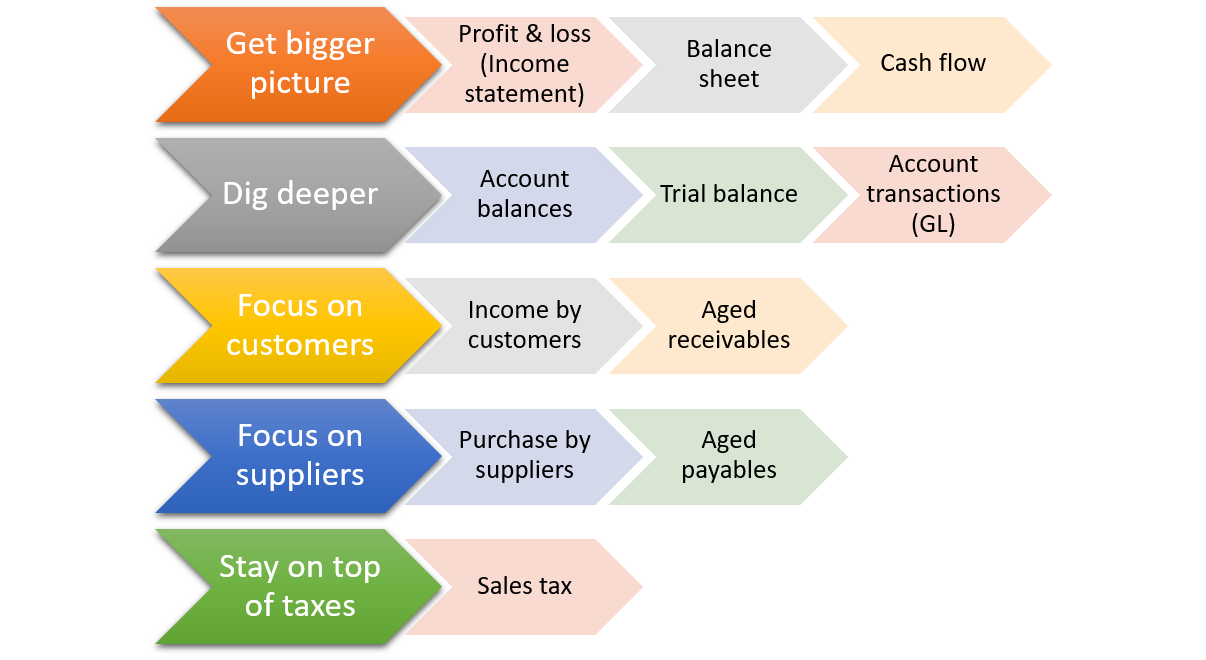
NERP's dashboard is a cockpit to track all key performance indicators, metrics and measures of all the core business modules namely - procurement, warehousing, sales order processing, inventory, HRMS, CRM and finance & accounting.
1. Customized Widget
Widget is a graphical representation of information. NERP allows you to customize these widgets as per your changing business requirement. NERP allow you to choose and pick the widget from a set of standard library.

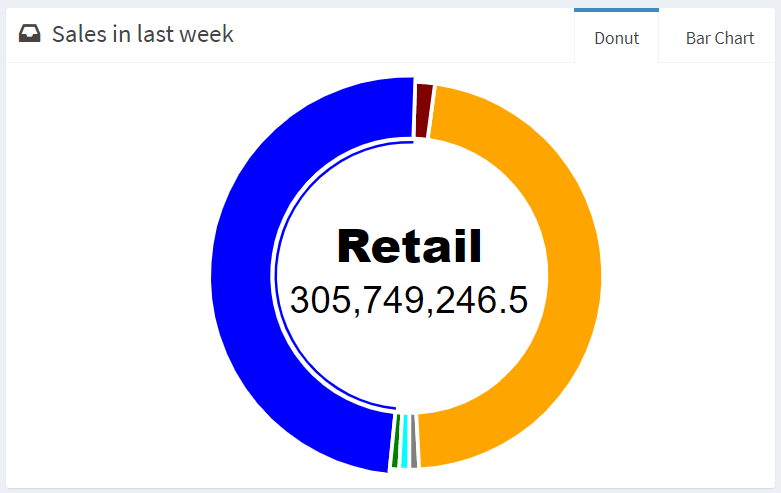
2. Data Models
NERP allows you to display your statistical data in form of different data models such as bar chart, donut, line chart, etc. Such models can be used to create viewpoints of any transactions (E.g. sales, procurement, inventory etc.) done in last week, month or year.
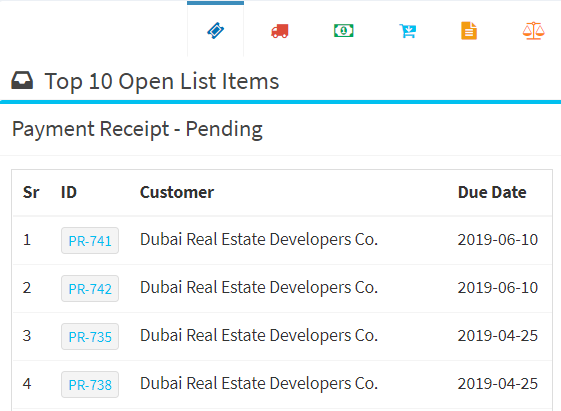
3. Top 10 open list items
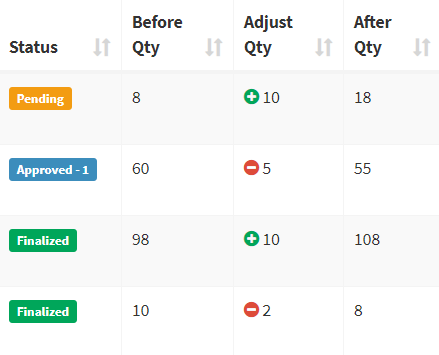
Single window to view different types of documents with status 'Pending' (E.g. payment, delivery order, sales invoice, sales order, quotation, costing sheet etc.). By clicking on the Doc ID, user will be navigated straight to their respective document type based on their roles and permission. You can even customize the Top X counter (E.g. 3, 5 or 10).
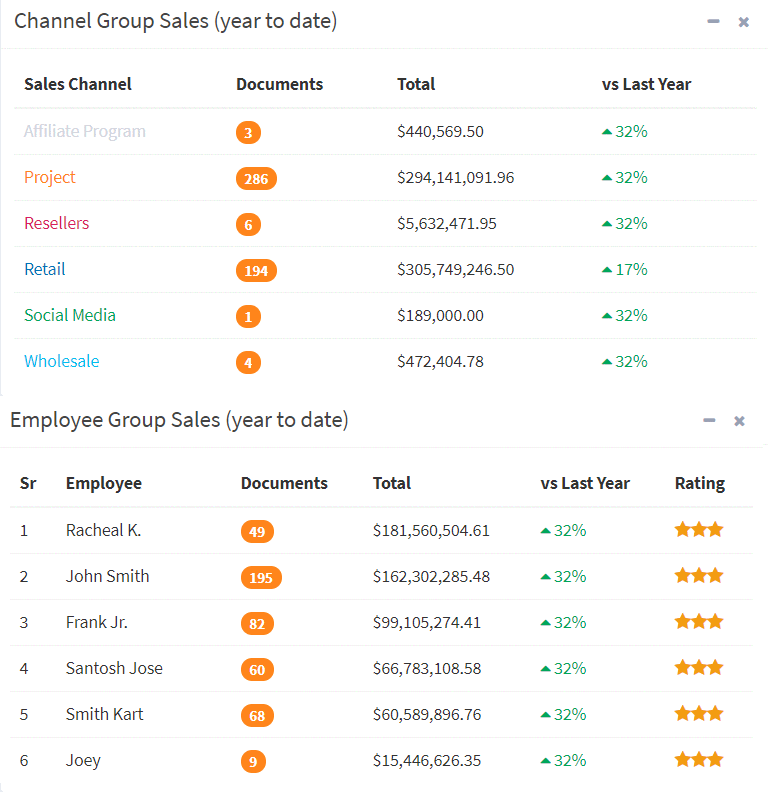
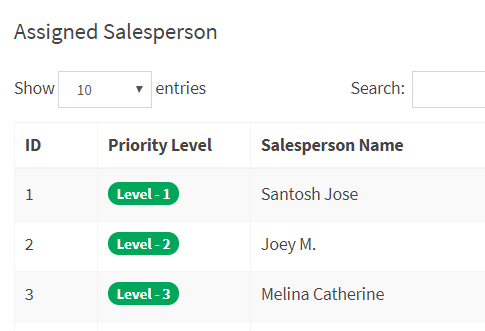
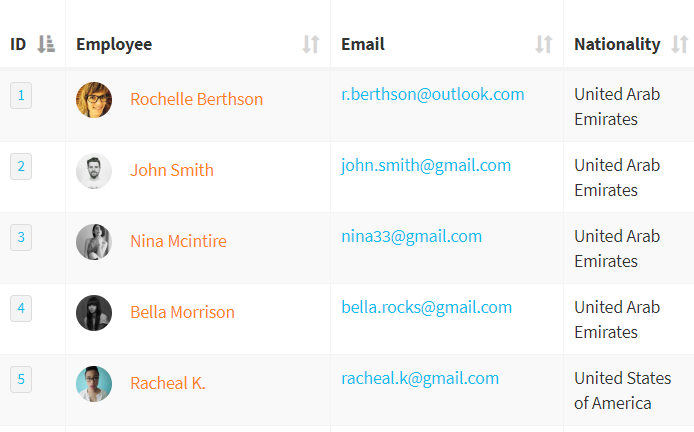
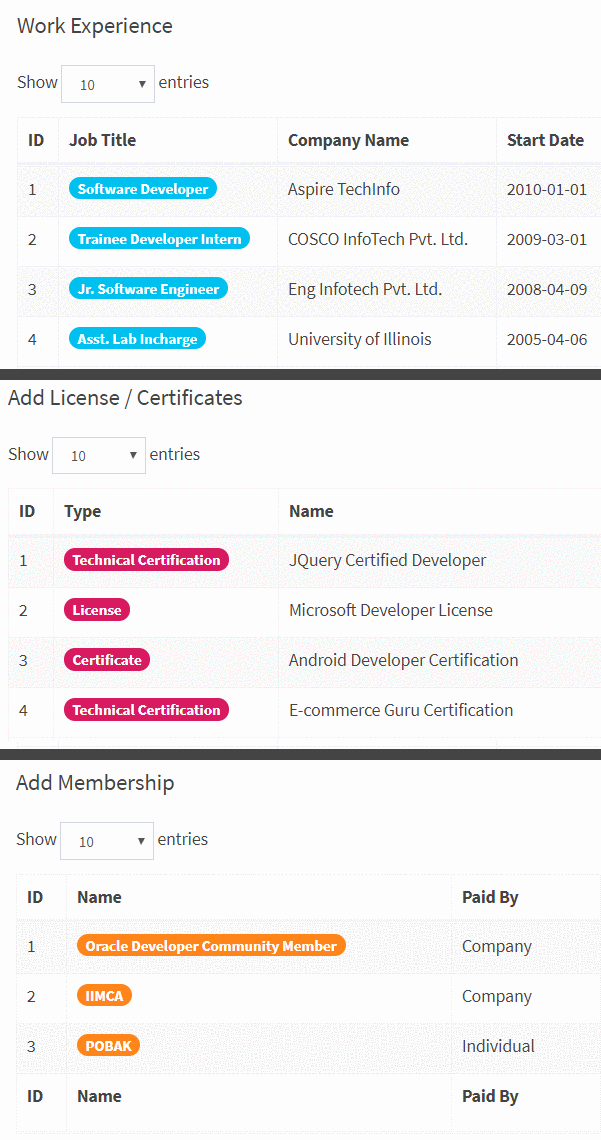
4. Data Tables
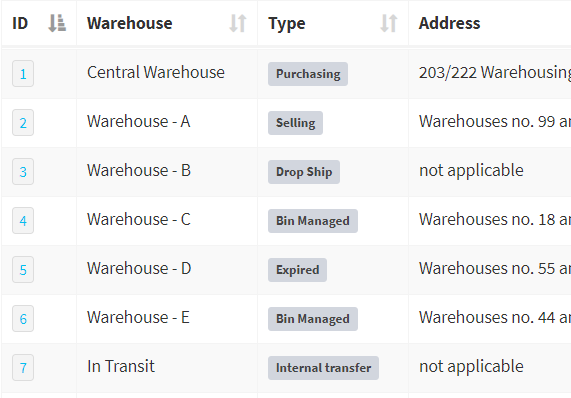
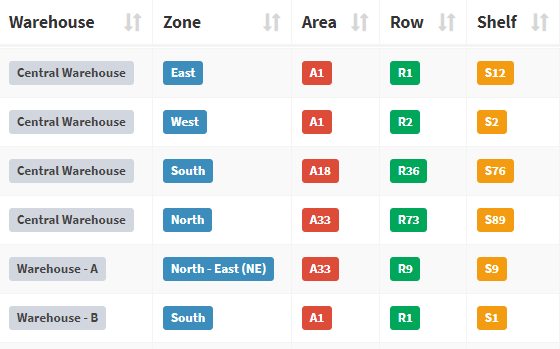
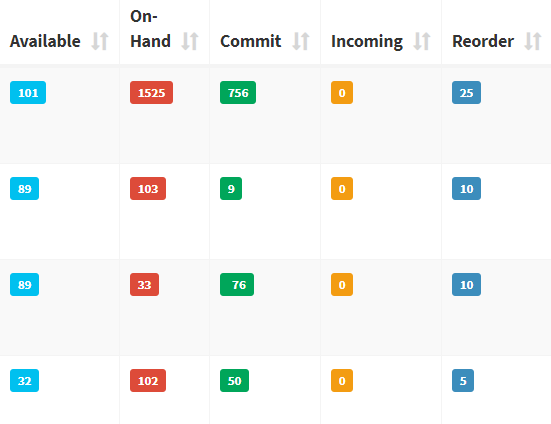
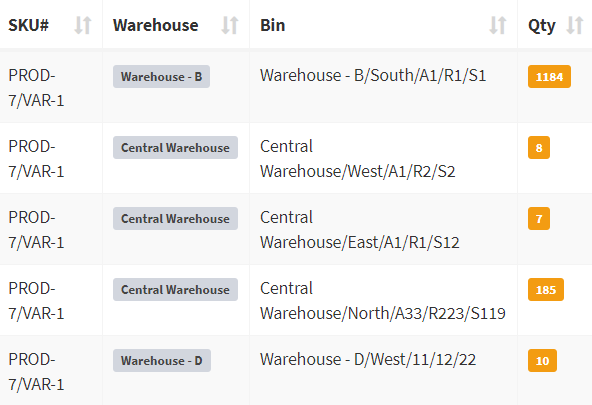
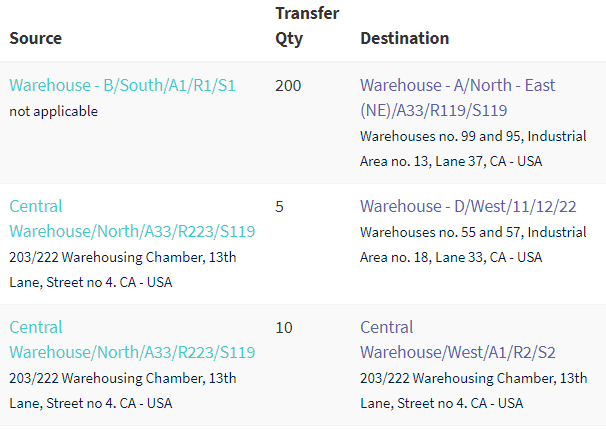
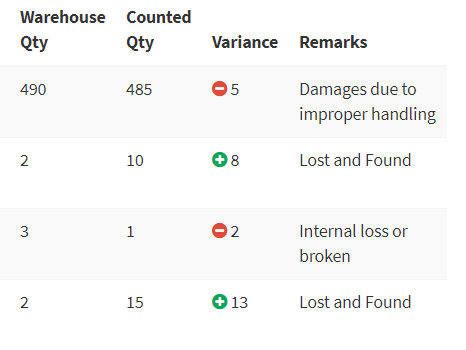
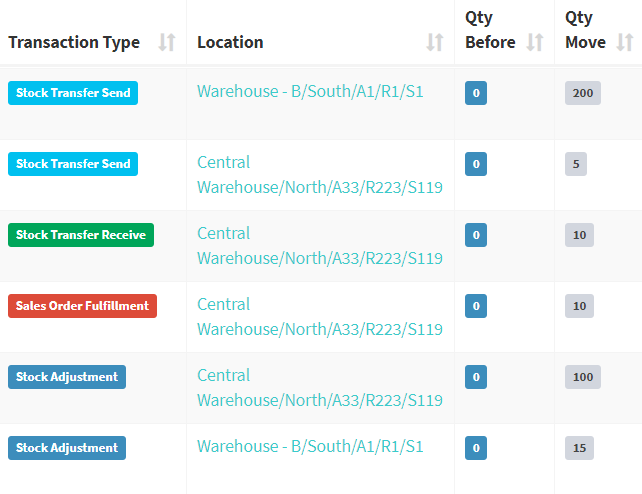
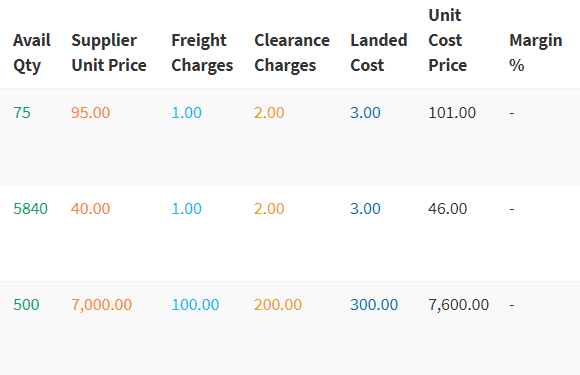
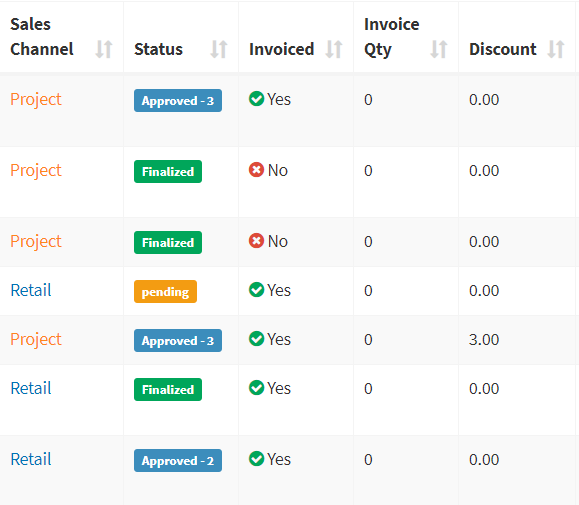
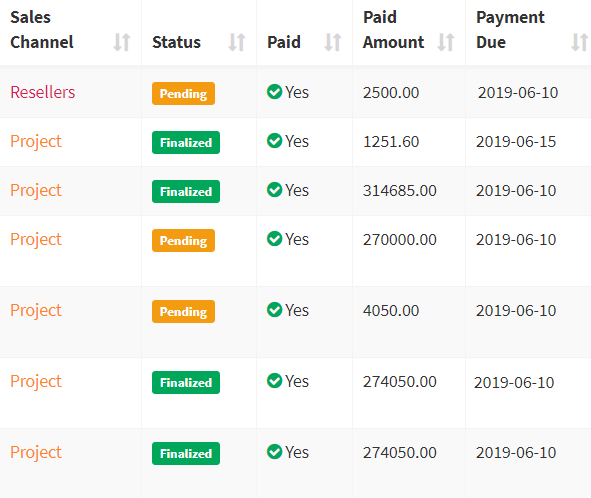
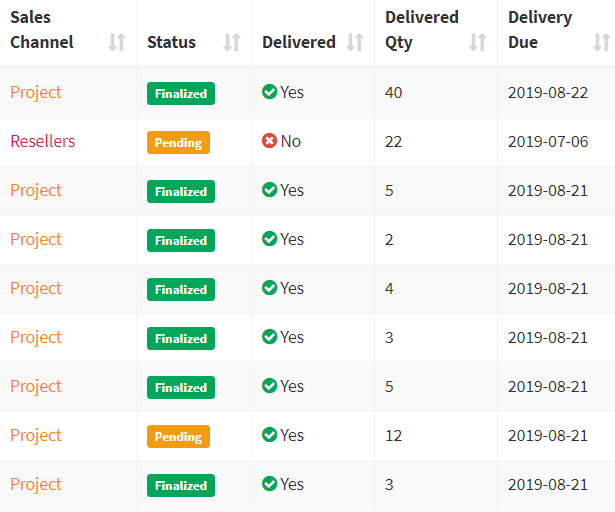
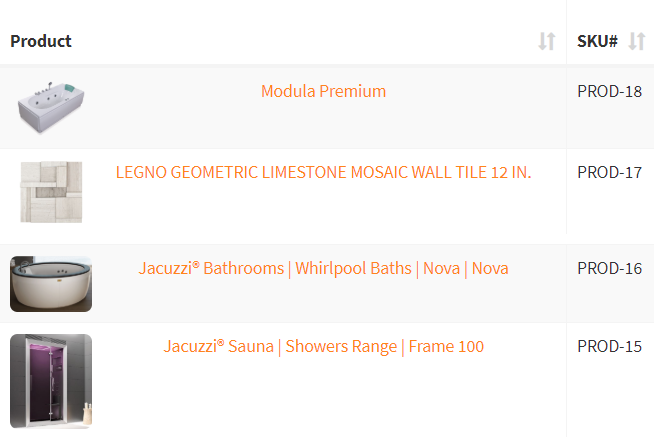
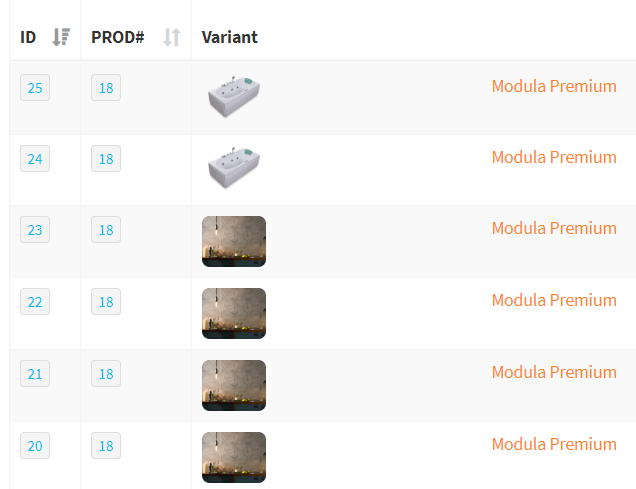
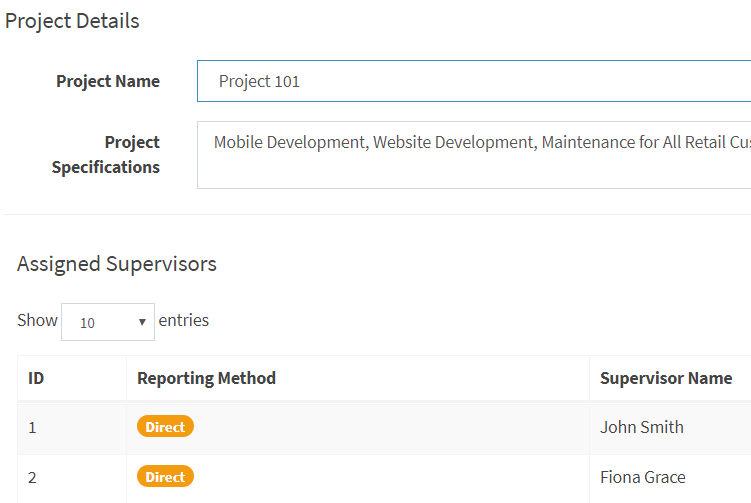
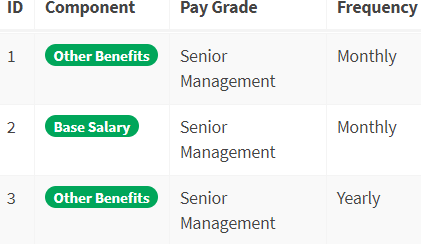
Customized data tables are created as per your business needs. (E.g. Item Group Sales, Employee Group Sales, Customer Group Sales, Channel Group Sales etc. NERP allows you to perform dynamic searches, display 'x' no. of records (where x = 10, 25, 50 & 100), sort by column name in either asec or desc order, minimize, maximize or close data table.

